Costs
The Costs screen (route /costs) shows what you have actually spent, and what
each declared game costs to run.
ECS + Fargate spend, per-game estimates, and trailing-window deltas.
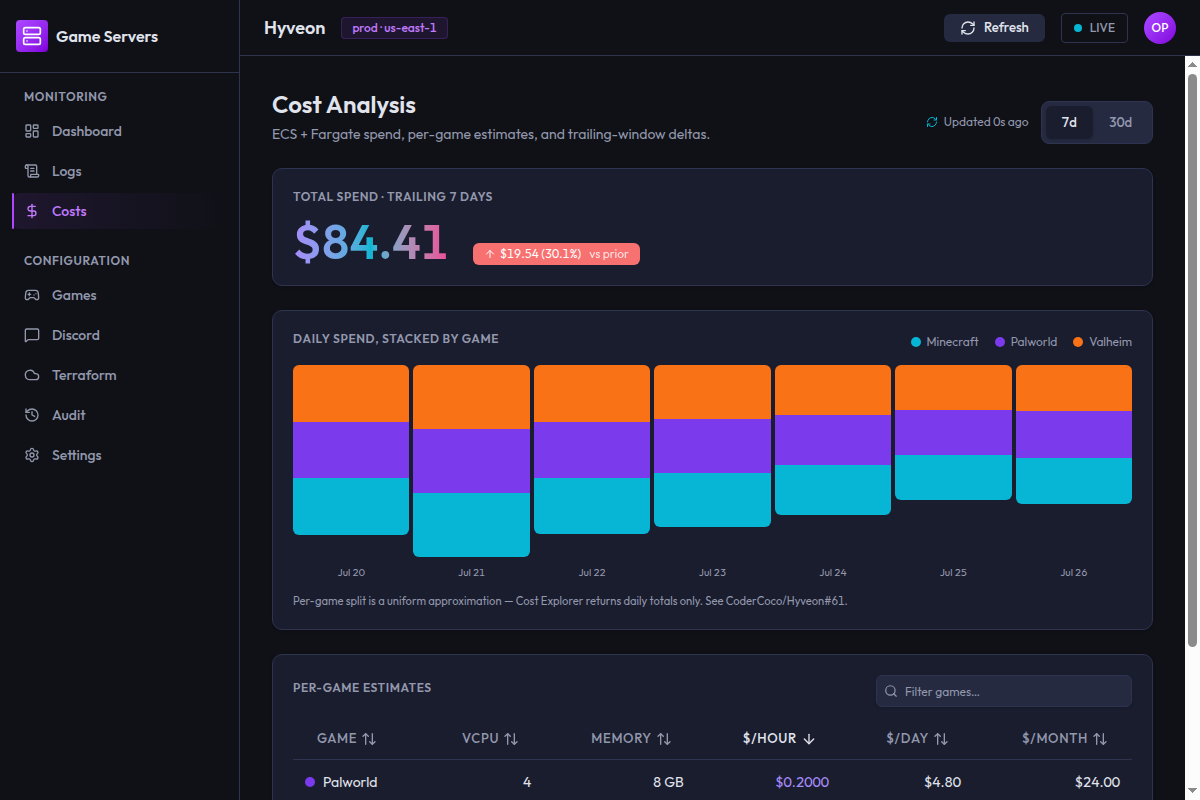
The page splits cleanly in two, and the two halves come from different places:
- Total spend and the daily chart are actuals, pulled from AWS Cost Explorer.
- The per-game table is an estimate, computed from each game's declared CPU and memory against published Fargate rates. It is not billing data.
Both are fetched when you open the page; the page does not poll.
Range selector
Two buttons in the header: 7d and 30d, defaulting to 7d. Cost Explorer only exposes daily granularity, which is why there are no hourly options.
Total spend
The headline figure is your total ECS + Fargate spend across the selected
window, titled Total spend · trailing 7 days.
The delta pill
Next to it, a pill compares that window against the window of the same length immediately before it. For a 7-day view, that is the previous 7 days; for 30d, the previous 30 days. The app fetches double the range in one call and splits it in half.
The percentage is computed against the prior window:
(current − prior) ÷ prior × 100
The pill shows the absolute change and percentage, e.g. ↓ $1.23 (14.7%) vs prior. The direction is carried by the arrow and colour: green with a down
arrow means spend fell, red with an up arrow means it rose.
When there is no prior data to compare against, the pill reads
no prior period.
The stacked daily chart
Daily spend, stacked by game
One column per day, each column split into a segment per game, with a legend in the card header. Hovering a segment shows the game and its value for that day.
Cost Explorer returns daily totals only — no per-service or per-game breakdown. The chart divides each day's total evenly across your configured games, so every game shows exactly the same share of every day, regardless of whether it actually ran.
The page says so itself, under the chart:
Per-game split is a uniform approximation — Cost Explorer returns daily totals only.
Read the column heights as real data — those are genuine daily totals. Read the segments as decoration only. Do not use the chart to work out which game is expensive; use the estimates table below for that, or your AWS bill.
X-axis labels are formatted in UTC so timezones behind UTC do not display the previous calendar day. Over a 30-day range the labels get crowded and are truncated.
If the estimates call failed, the games list is empty — the legend disappears and the columns render with no segments at all, even though the totals are fine.
Per-game estimates
A table of what each game costs to run, computed from its declared Fargate CPU and memory.
| Column | Contents |
|---|---|
| Game | Name, with its chart colour swatch |
| vCPU | e.g. 1 for 1024 CPU units |
| Memory | e.g. 4 GB |
| $/hour | Shown to four decimal places when under a dollar |
| $/day | |
| $/month |
Sort by clicking any column header; the default is $/hour descending.
Clicking a new column sorts descending for numeric columns and ascending for
Game; clicking the active column flips the direction.
The filter box in the card header (Filter games…) does a case-insensitive
substring match on the game name.
On a narrow window the table becomes a stack of cards with the same six values. The card stack has no sort controls.
What the day and month figures assume
The footnote under the table states it plainly:
$/dayassumes 24 hr/day.$/monthassumes 4 hr/day × 30 days.
So:
| Column | Formula |
|---|---|
$/hour | vCPU × $0.04048 + GB × $0.004445 |
$/day | $/hour × 24 |
$/month | $/hour × 4 × 30 — that is 120 hours, not a full month |
The two columns therefore answer different questions. $/day is the worst
case if you leave a server up around the clock. $/month is a realistic
monthly bill for a server used a few hours an evening — which is what the
start/stop-on-demand design is built for. Neither is $/day × 30.
Two further caveats:
- These are Fargate compute rates only. They exclude EFS storage, data transfer, Route 53, Lambda, DynamoDB and CloudWatch. Your real bill will be higher.
- The rates are hardcoded us-east-1 on-demand prices. If you deploy to another region, the estimates will be off by that region's premium.
If a game's task definition cannot be read, the estimate falls back to 2 vCPU
/ 8 GB — with no indication in the table that it is a fallback. A row showing
exactly 2 vCPU and 8 GB when you declared something else is the tell.
Estimates are fetched once and deliberately kept when you switch ranges — they do not depend on the date range, and refetching would mean an extra ECS call per game.
When there is nothing to show: No estimates available.
Requirements and failure modes
Cost Explorer must be enabled
Cost Explorer is opt-in per AWS account, and the app's IAM principal needs
ce:* (included in the HyveonDeployAll policy — see the setup guide).
There is also a lag: Cost Explorer data is not real-time, so today's figure
will be incomplete and very recent activity may not appear at all.
Activate the Project cost-allocation tag
Every resource Hyveon creates is tagged Project=hyveon. Activate the
Project tag under AWS Billing → Cost allocation tags so you can break
your bill down by project in Cost Explorer and in the AWS console.
Do this even though this page does not use it: the actuals shown here are not scoped by that tag. The query filters on the service dimension — Amazon Elastic Container Service and AWS Fargate — so if you run other ECS or Fargate workloads in the same account, their spend is included in these figures. Activating the tag is how you get a Hyveon-only view, in the AWS console.
What you see when it is unavailable
If Cost Explorer errors or returns nothing, this page shows:
| Element | Shows |
|---|---|
| Total spend | $0.00 |
| Delta pill | no prior period |
| Next to the pill | A red Cost Explorer: <error> note with the raw AWS message |
| Chart | No cost data available. |
| Estimates table | Unaffected — it is a separate call |
The $0.00 is a display artefact of the failure, not a measurement. The red
error note next to it is the real signal.
The dashboard handles the same failure differently: its
Spend today and Forecast MTD tiles show an em-dash rather than
$0.00, precisely to avoid implying you spent nothing.