Logs
The Logs screen (route /logs) tails one game server's CloudWatch logs live.
It is the first place to look when a server will not start, or when players
report something odd.
CloudWatch tail for the selected game. Pause to inspect; resume to flush the buffer.
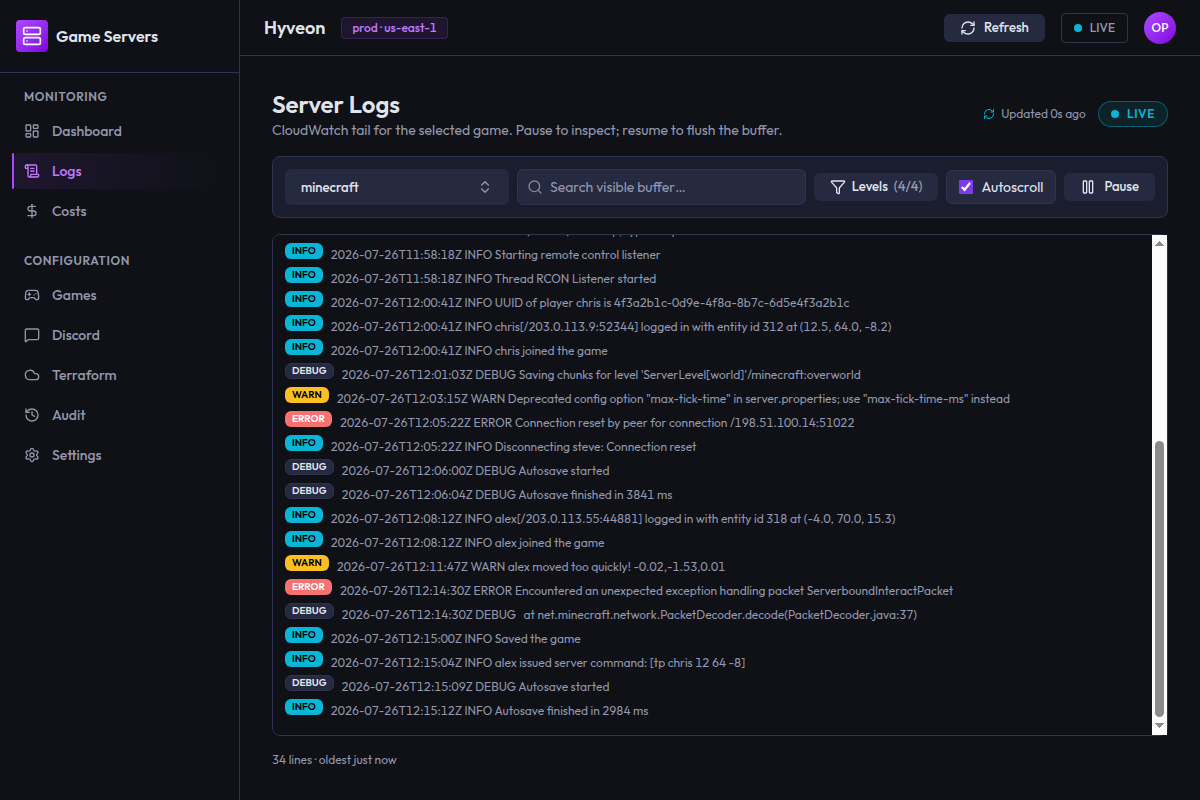
Where the logs come from
Logs are read from CloudWatch Logs, from the log group /ecs/{game}-server
— the group Terraform creates for each entry in your game_servers map.
Opening the page does two things: it fetches a snapshot of the most recent lines from the newest log stream, then it opens a live tail that polls CloudWatch every two seconds for anything new.
The live tail starts from the moment you subscribe, so it only shows lines produced from then on. Everything before that comes from the snapshot.
If Terraform has not been applied, the stream fails with Terraform not applied. Run 'terraform apply' first. If the game has never run, the snapshot
comes back as a single line reading No log streams found for minecraft. —
rendered as an ordinary log line, not as an error.
Choosing a game
The combobox at the top left shows the selected game, or Select a game….
Opening it focuses a search field (Search games…) so you can type straight
away; matching is a case-insensitive substring on the game name. If nothing
matches you get No games found.
Pick an option with the mouse, or Tab to it and press Enter. Press Escape or
click outside to close without changing anything.
Selecting a game restarts the stream. Specifically, switching games:
- clears the visible buffer,
- discards anything buffered while paused,
- resets Pause back to Live,
- clears any error,
- re-fetches the snapshot and reopens the tail.
Your search text, hidden levels and autoscroll setting are not reset.
Arriving here via a game card's Logs button pre-selects that game. If you open the page directly, the first game in the list is selected for you.
Log levels
Each incoming line is scanned for a level token:
/\b(INFO|WARN(?:ING)?|ERROR|ERR|DEBUG|DBG)\b/i
The match is case-insensitive and word-boundary anchored, and the first
match in the line wins. Aliases collapse: WARNING → WARN, ERR → ERROR,
DBG → DEBUG.
Matched lines get a coloured badge — INFO cyan, WARN amber, ERROR red,
DEBUG grey. Lines with no recognisable level get a blank space where the
badge would be, so the text stays column-aligned.
The Levels filter
The Levels button shows how many are visible, e.g. Levels (4/4). Opening
it reveals a Show levels menu with a checkbox for each of INFO, WARN,
ERROR, DEBUG — all checked by default. The menu stays open as you toggle,
so you can turn several off in one go.
Unchecking a level hides those lines from the view. Two things to note:
- Lines with no detected level are never hidden by this filter. They always show, whatever you have unchecked.
- Hiding is a view filter — hidden lines still count against the buffer cap described below.
The footer summarises the state, e.g. 142 lines · oldest 3m ago · 2 levels hidden.
Search highlights, it does not filter
The search box (Search visible buffer…) highlights matches in place. It
does not remove non-matching lines, and it does not change how many lines are
shown.
Matching is case-insensitive, and every occurrence in a line is highlighted, not just the first. Clearing the box removes the highlighting.
This is deliberate: when you are reading a stack trace, filtering a log to matching lines destroys the context you needed the search for. Use Levels when you want to narrow, and Search when you want to find.
Autoscroll
The Autoscroll checkbox is on by default: every new line jumps the view to the bottom. Unchecking it freezes the scroll position so you can read something while the stream continues.
Autoscroll is also suppressed while the stream is paused.
Pause and Resume
The button on the right toggles between Pause and Resume, and the pill
in the page header switches between LIVE and PAUSED.
Pausing does not stop the stream. New lines keep arriving; they are held in a buffer instead of being appended to the view. While paused, the footer shows how many are waiting:
buffered 37
Pressing Resume flushes that buffer into the view in one go and returns to live tailing. Switching games while paused discards the buffer and returns to Live.
The 1000-line buffer
The view holds at most 1000 lines. Once full, the oldest lines are dropped as new ones arrive. This is a view buffer, not a log retention setting — nothing is deleted from CloudWatch, and older lines are still there if you query the log group directly.
The pause buffer itself is not capped, so a long pause can accumulate more than 1000 lines; the cap is applied when you press Resume, keeping the newest 1000.
On a narrow window
Below a certain width the search box, the Levels menu and the Autoscroll
checkbox collapse behind a Filters button. When levels are hidden, the
button annotates itself, e.g. Filters (2 hidden). Expanding it reveals the
same three controls stacked vertically.
The game combobox and the Pause/Resume button stay visible at every width.
Empty and error states
Inside the log box:
| Situation | Copy |
|---|---|
| No game selected | Select a game to start tailing. |
| Game selected, nothing to show | Waiting for log lines… |
That second message also appears when every line you have received has been hidden by the Levels filter — if a busy server looks silent, check whether you left a level unchecked.
Errors appear in a red banner above the log box:
| Copy | Meaning |
|---|---|
Could not load games. | The games list failed to load, so there is nothing to select |
Could not load initial logs; trying live stream. | The snapshot failed; the live tail is still being attempted |
Stream ended with error: … | The live tail died |
IPC bridge (window.hyveon) is not available in this context. | The renderer lost its connection to the app's backend |
Transient CloudWatch hiccups during the tail are surfaced inline as a log
line rather than in the banner, prefixed [stream error].
What this page is not
- It does not show the Hyveon app's own logs. Those are on Settings → Diagnostics.
- It does not show Terraform output. That lives on the Terraform page and in run history.
- It does not show Lambda logs. Those are in CloudWatch under the Lambdas' own log groups — see Lambdas.