Settings
The Settings screen (route /settings) holds the watchdog tuning knobs, the
entry point back into the cloud setup wizard, and the app's own diagnostic log.
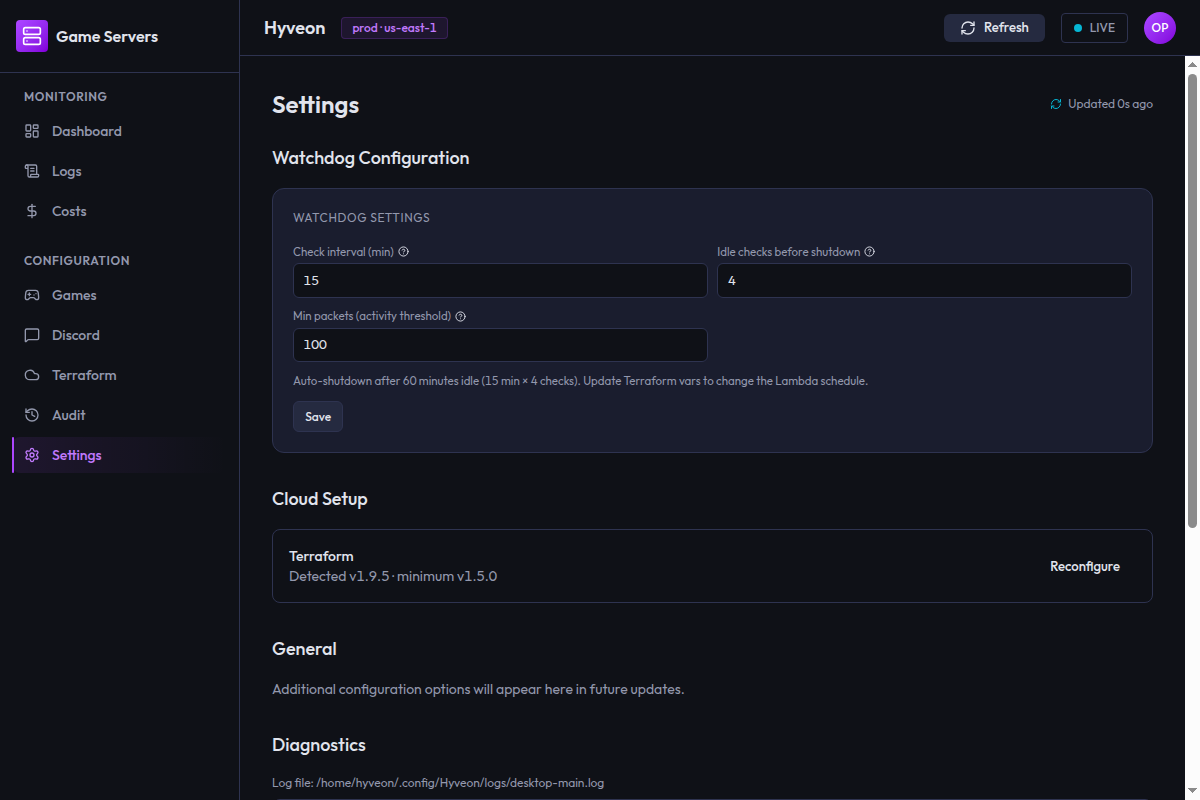
Four sections, in order: Watchdog Configuration, Cloud Setup, General, Diagnostics.
Watchdog Configuration
The watchdog is a Lambda that runs on a schedule, checks how much network traffic each running game server is seeing, and stops tasks that have been idle for long enough. It is what stops you paying for a server everyone forgot to shut down.
Three fields:
| Field | Unit | Default | What it means |
|---|---|---|---|
| Check interval (min) | minutes | 15 | How often the watchdog inspects each running task. Lower means faster shutdown but more Lambda invocations |
| Idle checks before shutdown | count | 4 | How many consecutive idle checks must pass before the task is stopped |
| Min packets (activity threshold) | packets | 100 | A task receiving fewer than this many network packets during an interval counts as idle |
Each field has a ? icon with a tooltip explaining it.
Below the fields, a derived line updates live as you type:
Auto-shutdown after 60 minutes idle (15 min × 4 checks). Update Terraform vars to change the Lambda schedule.
The formula is simply interval × idle checks. With the defaults, a server with no players stops an hour after the last packet.
Tuning advice
- Min packets is the one to adjust first if servers are being stopped while people are still connected. Some games send keepalive traffic even when idle; if the baseline chatter exceeds 100 packets per interval the server will never look idle, and if a connected-but-quiet player generates fewer, they will be cut off.
- Interval × idle checks is your grace period. Shortening the interval makes shutdown more responsive but also makes a brief network lull more likely to trip the counter — which is why the counter requires consecutive idle checks rather than a single one.
The idle counter is stored as a tag on the ECS task itself, so it resets naturally whenever a task starts.
Saving
One Save button. Success shows Watchdog settings saved.
Each field is validated as you type, and Save stays disabled while any of them is invalid:
| What you typed | Message under the field |
|---|---|
| Nothing — the field is empty | Required |
| Anything that is not a whole number | Whole number required |
| Below the field's floor | Must be N or greater |
The floor is 1 for the check interval and the idle-check count — either at
zero describes no watchdog at all — and 0 for the packet threshold, where
zero is meaningful: it makes every task read as busy. There is no maximum.
While the interval or the idle-check count is invalid, the idle-window summary
under the fields is replaced by Fix the highlighted fields to see the idle window.
These fields tune the app's stored configuration. The watchdog Lambda does not read that configuration.
The Lambda gets all three values from Terraform: its EventBridge schedule is
generated as rate(<interval> minutes) at apply time, and the idle-check and
packet thresholds are baked into its environment variables. Both come from
your Terraform variables, not from the app's settings file.
So pressing Save writes a local file and shows a success toast while changing nothing in AWS. The panel says as much in its own footnote — "Update Terraform vars to change the Lambda schedule."
To actually change the watchdog: set watchdog_interval_minutes,
watchdog_idle_checks and watchdog_min_packets in terraform.tfvars (see
the Terraform reference), then run a plan and apply
from the Terraform page.
There is no indication in the UI when the saved values and the applied Terraform values disagree, so keep them in sync by hand.
Cloud Setup
A single row showing the Terraform binary the app found:
Terraform Detected v1.9.5 · minimum v1.5.0
or Not detected · minimum v1.5.0 if the probe found nothing. The check is
best-effort, so a failed probe looks identical to Terraform genuinely being
absent, and there is no pass/fail styling even when the detected version is
below the minimum — compare the two numbers yourself.
Reconfigure
The Reconfigure button relaunches the setup wizard. It swaps out the whole Settings page immediately, with no confirmation.
Use it to switch AWS profiles, change region, or re-point Terraform at differently-named bootstrap resources. It runs a shortened, pre-filled variant of the first-run flow — four steps instead of five, every step collapsed to a summary with an Edit button, and all your edits buffered into a single save when you press Finish setup. There is a Cancel button throughout.
See First-run wizard → Reconfigure for the full behaviour, including what Cancel can and cannot undo.
Note that this section only reports Terraform. Your AWS profile, region and bootstrap resource names are not shown here — they are inside the wizard.
General
A placeholder:
Additional configuration options will appear here in future updates.
No controls.
Diagnostics
The last 500 lines of the desktop app's own log — the main process's structured log, not your game servers' CloudWatch logs and not Terraform output. This is where to look when the app itself misbehaves: a failed IPC call, an AWS SDK error the UI swallowed, a Discord command registration Discord rejected.
Above the log box:
Log file:
/home/you/.config/Hyveon/logs/main-2026-07-26.log
The exact directory is platform-specific (your user-data directory), but the
filename always follows the pattern main-YYYY-MM-DD.log using today's
local date. Logs rotate daily, and this panel only ever shows today's
file — there is no date picker. To read an earlier day, open the file from
that directory yourself.
The panel refreshes every five seconds and always scrolls to the bottom when it does, with no pin-to-bottom detection. Scrolling up to read something older will get yanked back within five seconds; copy the path and open the file in an editor if you need to study it.
There are no buttons — no copy, no open-folder, no export. The path is selectable text.
| State | Copy |
|---|---|
| Loading | Loading diagnostics… |
| No log file yet, or it is empty | No log lines available. |
| Read failed | The raw error message, in a red banner replacing the whole panel |
A brand-new install shows the empty state rather than an error, because the log file does not exist until the first write.